SIR: The What, How and Why
Ah, the SIR.
You’ve seen it in HAI tables or graphed on charts. You’ve heard your manager and infection preventionist (IP) talk about it.
It might make some sense, but you still don’t know exactly what the SIR is.
Join me in this head-first dive into the SIR so you know exactly what your data, your manager and your IP are talking about.
Please note, the SIR is straight-up statistics. I can’t write this post without throwing in some math, but I will keep it to a minimum. 😉
What Is an SIR?
SIR stands for standardized infection ratio. It’s a summary measure used to track HAI progress over time and identify opportunities for improvement.
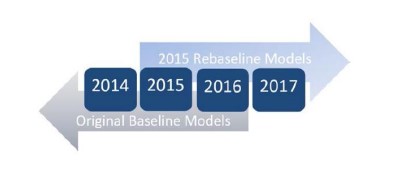
The SIR calculation is designed to measure your hospital’s HAI experience against a national standard. At this time, the national standard is aggregated data collected in 2015 (AKA 2015 baseline).
CDC, CMS and state and local health agencies use the SIR for public reporting. To see the SIR in action, check out Hospital Compare, Leapfrog, the VA and other healthcare quality and public health websites.
How to Calculate the SIR
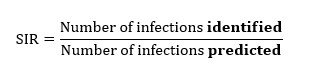
The SIR is the value you get when you divide the number of infections identified by the number of infections predicted in a specified time frame. In other words, it’s a ratio of identified to predicted infections.
The number of identified infections for a particular HAI, like CLABSI or CAUTI, is what the IP figures out.
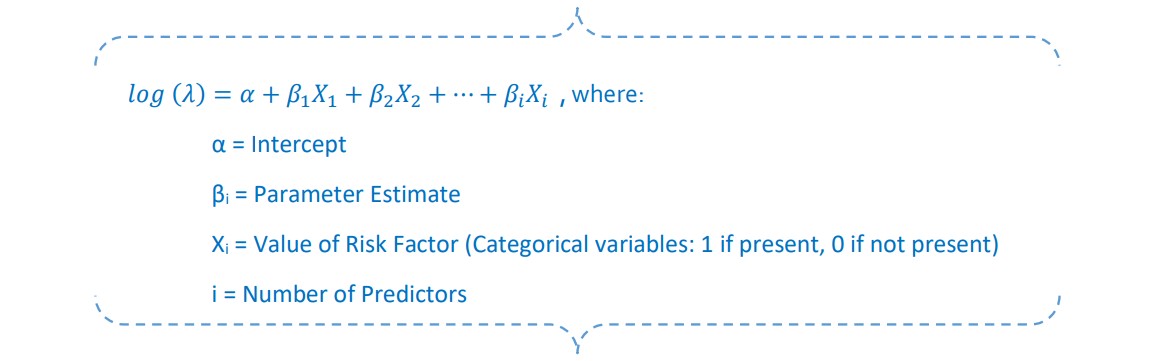
The predicted number of infections comes from CDC’s National Healthcare Safety Network, better known as NHSN. The calculation is based on risk factors known to predict HAI outcome. These risk factors are reported to NHSN by the hospital.
Let’s look at a CAUTI example:
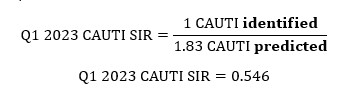
In the above example, the predicted number of CAUTI is greater than 1. The predicted value must be greater than or equal to 1 to get a statistically precise SIR. Precision is key!
NHSN can’t calculate a predicted value greater than or equal to 1 for a given unit or timeframe if there isn’t enough data. Too few device days is often a culprit—not a bad reason!
This is what happens if the predicted value is less than 1:
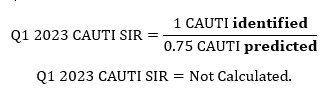
My process is to report “LTP” (less than predicted) or “GTP” (greater than predicted) on HAI reports if NHSN doesn’t calculate an SIR. This way, readers at least know the number of HAIs reported falls below or above the predicted number of HAIs.
How to Interpret the SIR
Whenever you divide a number into itself, you get 1. Consider 1 as the number your SIR should fall below.
| SIR value | SIR Interpretation | How You Feel Depending on Your Unit or Hospital SIR Goal |
| Less than 1 | Fewer HAIs were identified than predicted | We rock! |
| Equal to 1 | As many HAIs were identified as predicted | We could do better. |
| Greater than 1 | More HAIs were identified than predicted | We definitely have some work to do! |
Why Use an SIR?
The SIR is a standardized, risk adjusted measure allowing all 25,000+ NHSN-participating healthcare facilities to compare themselves against the same baseline. In addition, the SIR is used to compare hospitals with similar patient populations. The SIR levels the playing field.
Risk adjusted means certain facility-level and patient-level factors influencing infection risk are considered when calculating the SIR.
Facility-level risk factors include elements like hospital type (e.g., oncology, children’s or military hospital) and beds size (more beds = more risk).
Patient-level risk factors include elements like patient location in the hospital (e.g., ICU or medical/surgical ward) and number of device days (more device days = more risk).

Call to Action
Know Your Data
Now that you’ve gotten your feet wet, have a look at the HAI data for your unit. Make note of the SIR trends. The data will have so much meaning to you now!
If HAI data isn’t posted on your quality board, have your manager post it there because it belongs there!
And above all, feel confident when looking at your unit or hospital HAI data and question your IP or manager if it doesn’t make sense.
It’s your data. You deserve to understand it.